Supply and demand
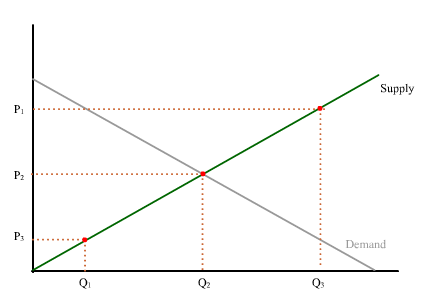
Market prices and quantities supplied and demanded are determined by the interactions between supply and demand.
Glossary:
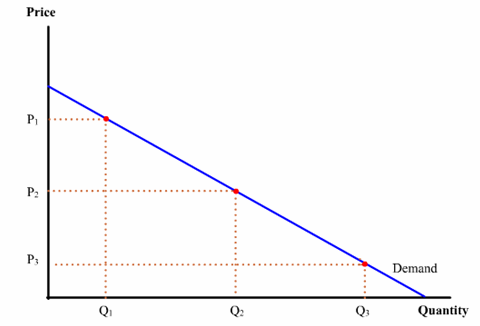
- demand schedule (curve)A set of price-quantity points that depicts how quantity demanded of a good is affected by changing prices. In graphical terms, a demand schedule is generally a downward-sloping curve with price on the vertical axis and quantity demanded on the horizontal axis. The downward-sloping curve shows the inverse relationship between price and quantity demanded. On a given demand curve, factors other than own price that might also affect quantity demanded are assumed to be unchanged.

- supply schedule (curve)A set of price-quantity points that depicts how quantity supplied of a good is affected by changing prices. In graphical terms, a supply schedule is generally an upward-sloping curve with price on the vertical axis and quantity demanded on the horizontal axis. The upward-sloping curve shows the positive relationship between price and quantity demanded. On a given supply curve, factors other than own price that might also affect quantity supplied are assumed to be unchanged.

Topics:
Keywords
demand, demand shift, excess demand, excess supply, price determination, shortage, supply, supply shift, surplus
