Who Is Over a Barrel?
The impact of low oil prices on oil output depends on the cost structures of different types of oils.
When OPEC decided not to cut oil output to stabilize world oil prices in the face of weak global demand, oil price continued its slide from over $100 in June 2014 to under $50 per barrel in January 2015 (NY Times). Observers speculated that the decision not to cut output by Saudi Arabia, leading OPEC producer and historically a reliable oil price stabilizer, was an attempt to squeeze out the high-cost producers (Economist).
Here seems to be a textbook case of market disequilibrium resulting from declining demand and increasing supply. But what makes this case more interesting is the story behind the increasing supply. The seemingly unstoppable oil price hike to over $100 per barrel fueled by demand from emerging economies helped make the fracking of shale oil in America profitable. At 25 - $70 per barrel, shale oil was much more expensive to extract than Persian Gulf oil at $1.5 to $2 per barrel (barchart.com), but the spread between price and cost was still substantial. The growth of shale oil was explosive. New wells added since 2010 was more than 10 times those added in Saudi Arabia and have increased America's oil output by a third (Economist).
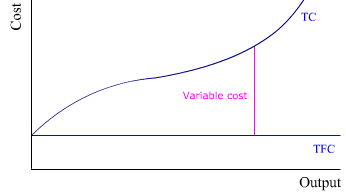
The sudden big drop in oil prices have led to major reduction in capital investment and layoffs in the shale oil sector. Since shale oil wells have short lives, shale oil output will fall as development of new wells are curtailed. But because shale oil wells are relatively inexpensive (millions) and much faster (weeks) to drill compared to deep-sea and Arctic oil wells, output of shale oil can bounce back as soon as oil prices go up again. And those who survive are more lean and mean (WSJ 1/14/2015). We can look at shale-oil producers as operating under mostly variable costs. So OPEC's strategy of squeezing out high-cost shale-oil producers is unlikely to have any long term effect.
If it is difficult to squeeze out high variable-cost shale-oil producers with low prices, it is even more difficult to squeeze out existing high-cost producers in oil-sands oil. Specifically, it takes years and costs billions to develop new oil sands fields. But once a field is developed, it will produce hundreds of thousands barrels a day for up to three decades. In other words, most of the costs of oil-sands oil are fixed once a field is developed. The average total cost of oil-sands oil falls as more oil is extracted and the huge fixed costs are spread over a larger output (WSJ 1/13/2015). So lower oil prices will not seriously discourage oil output from existing mines. Oil-sands oil from Canada will continue to displace heavy crude oils from countries like Mexico and Venezuela in the American market.
Given the reality of the supply situation, oil prices will not regain its strength until global demand is revived.
Meanwhile, not many oil exporting countries can long stand a low-price regiment. They have grown to rely on oil revenues to sustain their over-stretched budgets. The oil-exporting economies of Russia, Nigeria, Iran and Venezuela are essentially on life support due to the unexpected low oil prices. Output control is hopelessly ineffective even among members of the OPEC cartel. The emergence of significant non-OPEC producers has further weakened any chance of collective action to control output. On the other hand, American gasoline consumers can once again indulge their love of gas-guzzling vehicles (WSJ 12/30/2014).
References:
- barchart.com. 11/27/2014. "Target low-cost oil producers like Continental Resources."
- NY Times. 1/12/2015. "Oil prices: What’s behind the drop? Simple economics."
- Economist. 12/6/2014. "Sheiks v shale."
- WSJ. 1/13/2015. "As oil slips below $50, Canada digs in for the long haul."
- WSJ. 1/14/2015. "Back to the future? Oil replays 1980s."
- WSJ. 12/30/2015. "Low gas prices defy efficiency goals."
Glossary:
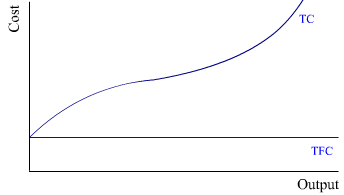
- fixed costCost that stays the same in the short run regardless of the level of output or action taken. Graphically, fixed cost is represented by a horizontal line from the cost axis in the cost-output space.

- variable costCost that varies with the level of output or action taken. Under short-run diminishing returns, variable cost will eventually increase at an increasing rate even though fixed cost stays the same.

Topics:
Keywords
demand, fixed cost, oil sands, OPEC, shale oil, supply, variable cost
