Circular Flow (transcript)
The circular flow diagram captures the big picture of how different sectors of an economy are connected to one another by flows of money and goods.
Closed economy
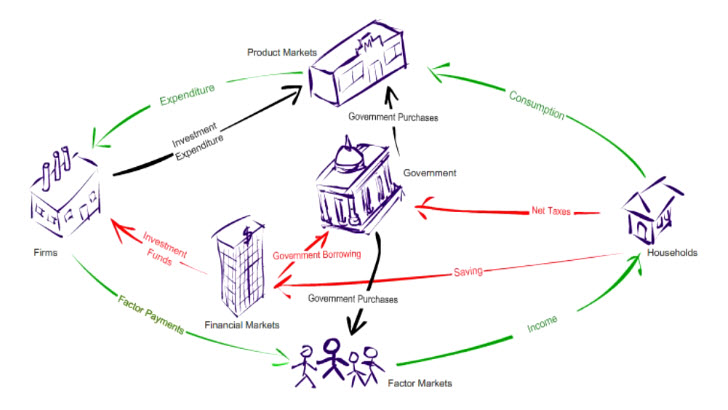
Let's us assume there are two sectors to start with in a simple closed economy; namely, the households and the firms. And these two sectors are linked by two markets, the factor markets and the products markets.
Households provide factor services via the factor markets to the firms. In return, firms pay households for the factor services.
But in order to pay the households, firms must sell their output via the product markets to the households. In return, firms receive payments from households. So the circular flow of payments and products is now completed.
Financial Markets
Let's concentrate on the circular flow of money payments in this closed economy. In this diagram, everything that is produced is devoted entirely to current consumption and firms do not invest at all for future production. But households may not spend all their income on current consumption and firms do invest for future production.
So we need financial markets to channel household saving to the firms for investment. The red arrows represent leakage from the circular flow. When the firms spend the investment funds in the product markets, the leakage from the spending stream is recycled back to the circular flow.
Government
What about the government? Don't taxes also represent leakage from the spending stream? We indicate this drain "net taxes" because the government also transfers payments to the households. But the government can be depended upon to recycle net taxes back to the spending stream via the factor markets and the product markets. If the government runs a deficit, it must also borrow from the financial markets.

Open Economy
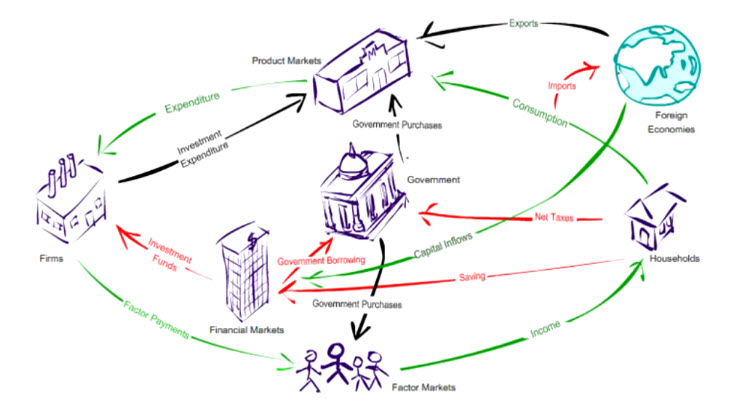
Let's open up the economy to the foreign economies. When the domestic economy imports from the outside world, payments for imports represent leakage from the domestic spending stream. This leakage is recycled back to the domestic economy when it exports to the outside world. If the imports exceed exports, the trade deficits may also be recycled back to the domestic financial markets to fund spending from the government, households or firms.

Summary
*Saving, net taxes, imports are leakages from the spending stream.
*Investment, government purchases, and exports are injections into the spending stream.
*A completed circular flow does not imply that the economic pie will stay the same size in the next round.
*If the economy is out of equilibrium, the economic pie may shrink or grow in the next round.
*The economy is in equilibrium only if planned leakages are equal to planned injections.
Glossary:
- circular flowA model of how different parts of the economy are connected through the flows of physical goods and services mediated by counter-flows of money payments.
- planned vs realizedIn the real world, what is realized may not be what is planned. For example, a married couple does not imply a happily married couple. But the marriage will last only if the couple is happily married. In terms of income determination, a given level of income can be sustained only if planned investment is equal to planned saving because what is not spent on consumption must be plowed back into investment to stop the leakage from the income stream. But in terms of income accounting, realized saving must always be equal to realized investment. For example, capital goods that are not sold end up as unplanned inventory of the producer.
Topics:
Keywords
circular flow, closed economy, consumption, exports, factor markets, financial markets, firms, foreign economies, government purchases, households, imports, income, injection, investment, leakage, net taxes, open economy, product markets, saving
