The Yield Curve
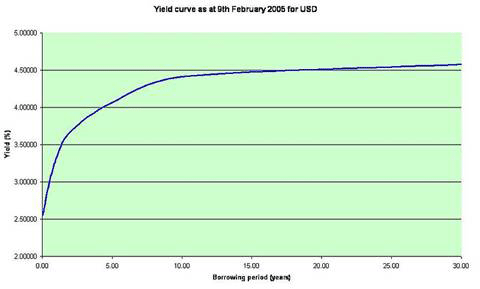
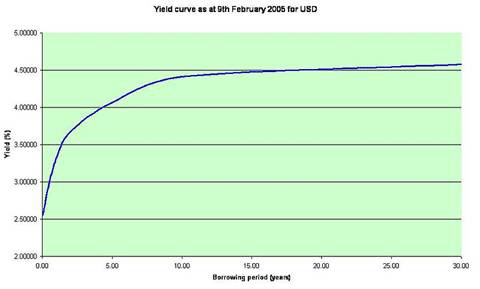
The yield curve depicts how yields of Treasury debts vary with their borrowing durations.
Because price inflation erodes the purchasing power of cash money, investors usually expect a higher interest rate to lend longer term than shorter term to anticipate possible future inflation. So when the US government borrows money by issuing Treasury debt instruments (variously called bonds, notes or bills depending on how long the instrument duration is), it must pay higher interest rates for longer-term debt than shorter term debt. Thus, a ten-year Treasury note usually pays a higher interest rate than a 2-year Treasury note.

If we plot the interest rates against the borrowing durations, we would see a positively sloping yield curve.
On 12/21/2009, the main gauge of the yield curve (the difference between the yields of a 10-year and 2-year note) widened to 2.81 percentage points. Such a wide yield gap was last seen in 1992 and 2003.
A steep positive yield curve can portend two opposite futures. One, it may foretell a sustained economic recovery. Two, it may anticipate a period of price inflation.
The steep yield curves in 1992 and 2003 were followed by a sustained recovery. The yield gap widened because the Federal Reserve kept short-term interest rates low at least a year into the economic recoveries. And the yields on longer-term bonds rose because investors were selling bonds in favor of rising stocks.
But the current steep yield curve is due to a combination of very low short-term interest rates and very high anticipated supply of longer-term government bonds. The two-year note is currently yielding 0.92 percent. At the end of November 2009, it hit a closing low of 0.66 percent, lower than at any time in the last 25 years. The intention of the Federal Reserve to keep short-term interest rates low for an extended period time may fuel another asset bubble leading to price inflation as people try to borrow at low short-term interest rates to speculate on higher-yielding longer-term investment.
The low short-term rates also encourage investors to sell bonds in favor of stocks forcing the government to pay higher coupon rates for new bonds. Rising stocks further induces flight from bonds thus further steepening the yield curve.
The Treasury is expected to issue as much as $2 trillion in government debt in 2010. Such heavy government borrowing to stimulate the economy and to fund wars and new and existing entitlements in 2010 may also stoke fears that the new spending will depress the dollar and drives import prices higher.
This fear of price inflation is obviously not shared by the Federal Reserve who has promised to keep short-term interest rates low for the foreseeable future. But its hands are tied because it is more concerned about reviving the recessed economy.
On the other hand, the inflation breakeven rate1 has increased from -0.08 in 11/20/2008 to above 2 by the end of 2009. The increasing gap suggests investors have changed from an expectation of deflation to an average annualized inflation of 2% over the next decade.
Notes:
- The difference between the yields of 10-year Treasury notes and Treasury inflation-protected securities (TIPS).
References:
- Bloomberg.com. "TIPS 10-Year Breakeven Rate Climbs to 1% on Inflation Concern.". 1/29/2009.
- BW. "Yield curve predicting inflation, not growth surge."12/24/2009.
- Seekingalpha.com. "An 80-Year Yield Curve History and its Implications.". 1/10/2007.
- Wikipedia.com. "Yield Curve."
- Wisegeek.com. "What is a bond yield?"
Glossary:
- bondA fixed-income (coupon) debt security issued by corporate or government borrowers. At issue, the coupon interest rate varies directly with the duration (maturity) of the bond and inversely with credit-worthiness of the issuers and is tied to the face value of the bond. The market price of the bond after initial issue may change depending on supply and demand while the coupon stays the same. So the yield (coupon/market price) varies in opposite direction with the market price.
- inflation breakeven rateInflation breakeven rate refers to the difference between the nominal yield on 10-year Treasury notes and the real yield on 10-year Treasury inflation-protected securities (TIPS).
- yieldThe return on an investment. In the case of bonds, the yield that is of interest is the current yield, which measures the fixed coupon payment as a percentage of the current market price of the bond. The current yield varies inversely with the current market price of the bond. The current yield can be contrasted with the coupon rate, which measures the fixed coupon payment as a percentage of the face value of the bond at issue date.
- yield curveThe yield curve depicts how yields of Treasury debts vary with their borrowing durations (i.e., maturities).

Topics:
Keywords
inflation, inflation breakeven rate, recovery, TIPS, Treasury bonds, Treasury inflation-protected securities, yield curve, yield gap
